
Figure 3.
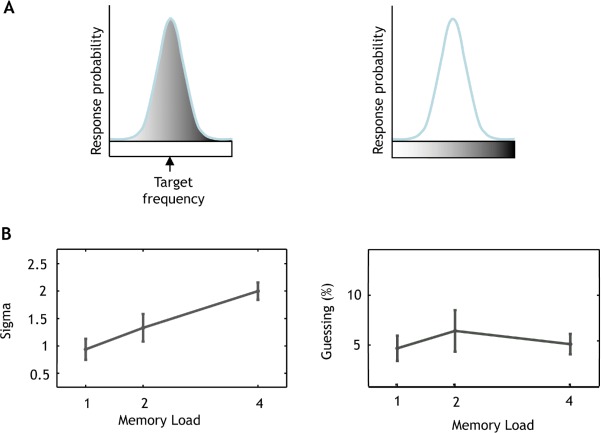
Probabilistic modeling of response distribution.
Notes: (A) Error of subjects’ responses. Subject responses were decomposed into two components, illustrated by the shaded regions. The first component (left panel) captures responses directed at the target as a Gaussian normal distribution centered on the target frequency. The second component (right panel) captures random responses unrelated to any of the test tone frequencies as a uniform distribution. (B) Model components for each memory load. The variability of responses is expressed by the parameter sigma (σ) describing the standard deviation from the actual target frequency. Fitted precision increased with an increase in the number of tones in the sequence (left panel). The proportion of random responses (guessing percentage) is constant across memory loads (right panel), also showing that the proportion of responses directed at the target does not decrease with an increase in memory load. Errorbars represent one SEM.