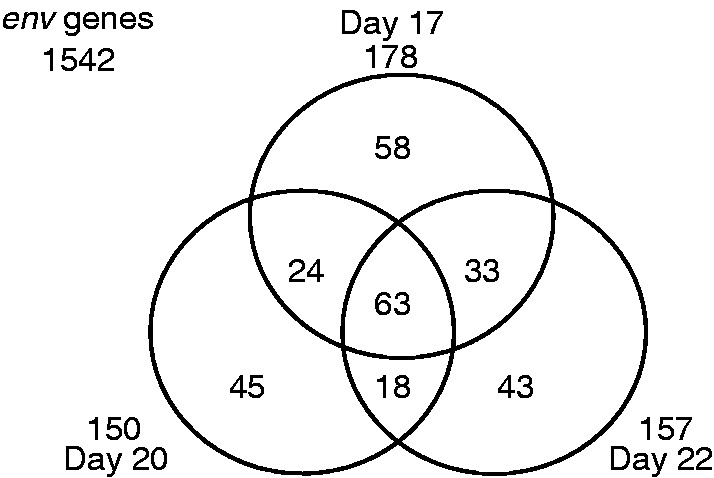
Fig. 1.—

Summary of env-derived sequences detected by the SOLiD sequencing. This Venn diagram exclusively shows the number of shared env-derived sequences detected by the SOLiD sequencing for day 17 (top middle), day 20 (bottom left), or day 22 (bottom right).
