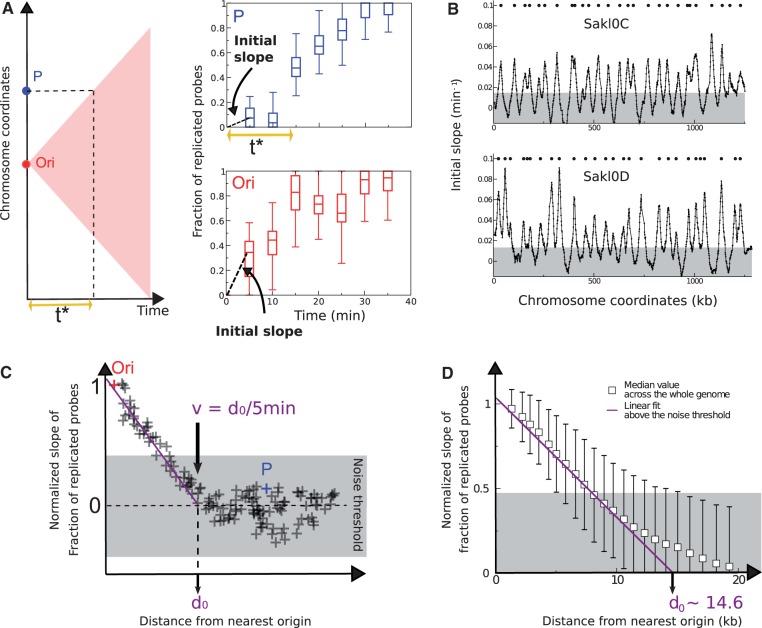
Fig. 4.—
Inference of replication origins and fork velocity from the initial slope method. (A) Illustration of the replication delay t* in the first 5 min of the S-phase. In case the replication origin (Ori in red) initiates exactly at the start of the S phase (t = 0 min), the replication forks move in time following the edges of the pink triangle (left panel) and reach locus P at time t* ∼ 15 min (top right panel). Initial slope (estimated at t = 5 min) at locus P is smaller than the one at the Ori locus (compare top and bottom right panels). The box plots of the fraction of replicated probes versus time rise immediately at Ori (the data refer to the origin with coordinate 828,007 on chromosome Sakl0H), whereas they stay close to zero for the P locus (located at coordinate 858,544 bp on chromosome Sakl0H) for the two first time points (5 and 10 min). (B) Discrete slope plotted as a function of genome coordinates. Data are averaged on a sliding window of 10 with 1 kb step. The peaks correspond to origins and are a proxy for their firing rate (the unit of the y axis is an inverse time in minutes). The gray-shaded area is the noise threshold, estimated as twice the standard deviation of negative-slope data (see Materials and Methods). (C) Method of estimation of the maximum distance d0 covered by replication forks in the first 5 min of the S-phase. The initial slope of the fraction of replicated probes decreases moving away from the origin (Ori). The distance where the slope becomes null (d0=v/5 min) is obtained extrapolating linearly the trend above the noise threshold. The initial slope of this plot can be used to estimate fork velocity. At the point where the initial slopes drops to zero, the velocity is obtained dividing the distance from the origin (d0) by the time taken by the replication front to reach that point (5 min in our case). (D) Evaluation of the fork velocity from genome-wide data. The genome-wide fork velocity is estimated from normalized discrete slope of the fraction of replicated probes as a function of time. The slope is divided by the slope at each origin and plotted as a function of distance from the origins, for all loci and origins. The distance d0=v/5 min where the slope becomes null is obtained extrapolating linearly the trend above the noise threshold, which gives the estimate d0 ∼ 14.6 kb and v ∼ 2.9 kb/min.

