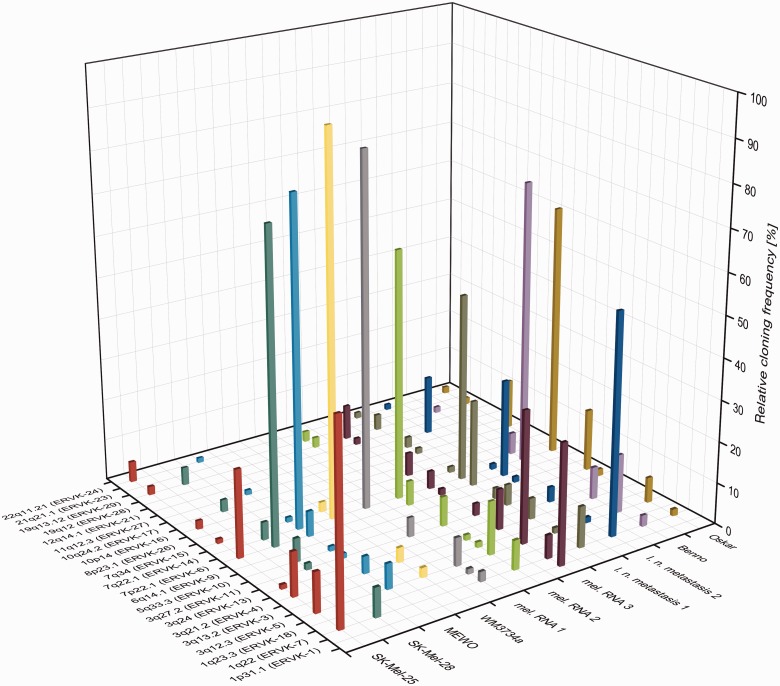
Fig. 3.—
Transcription profiles of HERV-K(HML-2) loci in melanoma. HML-2 gag cDNA sequences were amplified from melanoma cell lines SK-Mel-25, SK-Mel-28, MEWO, and WM3734a, three melanoma RNA samples, two lymph node metastases, and melanocyte cell lines Benno and Oskar. HML-2 loci are indicated on the x axis by chromosomal band and, if available, HGNC approved names. Samples are indicated on the y axis. l. n., lymph node; mel., melanoma. Given on the z axis are relative cloning frequencies as percentages of cDNA sequences that could be assigned unambiguously to particular HML-2 loci, approximately corresponding to transcription levels of those loci in the particular sample. See table 1 for further details.

