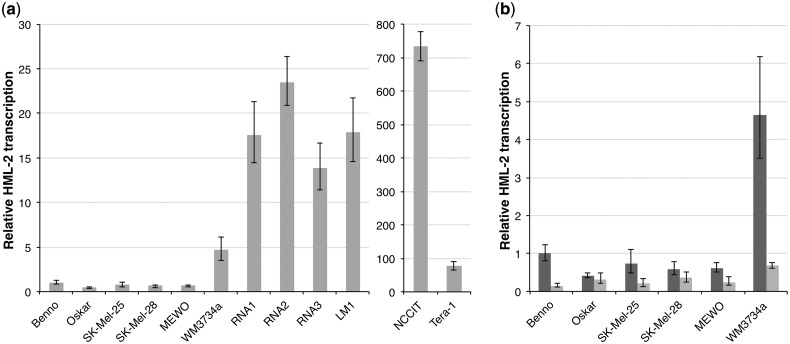
Fig. 6.—
Quantitation of HERV-K(HML-2) gag transcription by qRT-PCR. (a) Relative HML-2 gag transcript levels in melanoma cell lines SK-Mel-25, SK-Mel-28, MEWO, and WM3734a, three melanoma RNA samples, a melanoma lymph node metastasis (LM), and melanocyte cell lines Benno and Oskar, as well as GCT cell lines NCCIT and Tera-1. HML-2 transcript levels were normalized to transcript levels of G6PDH and RPII housekeeping genes. Gag transcript level in melanocyte cell line Benno before UV treatment was taken as reference. Black bars indicate minimum and maximum relative levels of gene expressionas calculated by StepOne software (see Materials and Methods). Note the different scale for NCCIT and Tera-1 cells. (b) Relative HML-2 gag transcription in melanoma and melanocyte cell lines before (dark gray bars) and 24 h after irradiation (light gray bars) with 200 mJ/cm2 UVB.

