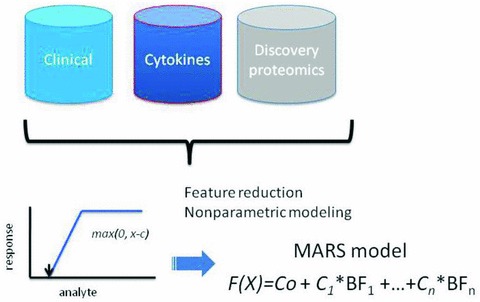
Figure 2.

Schematic diagram of modeling strategy to identify predictors of DHF using different data types. Data sources include: clinical demographics, normalized spot intensities by 2‐DE analysis, and log2‐transformed cytokine measurements. MARS produces a linear combination of basis functions (BFs), each represented by the value of the maximum of (0, x‐c), where x is the analyte concentration.
