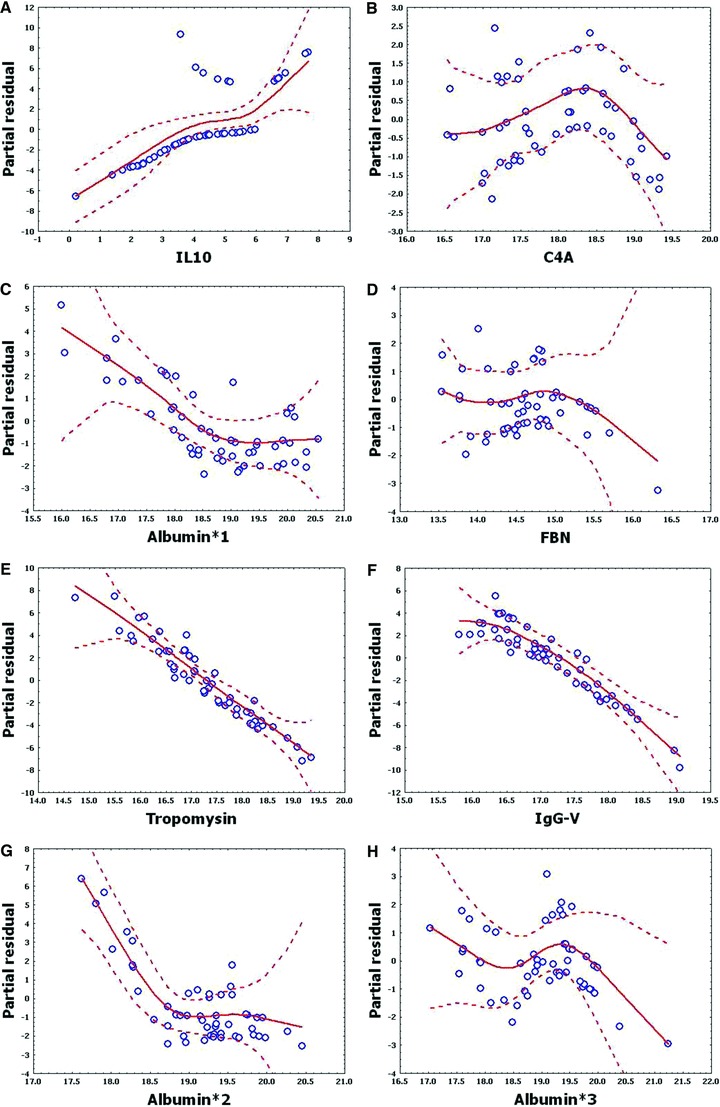
Figure 7.

Shown are the partial residual plots for log‐transformed values of eight proteins important in MARS classifi er. Y‐axis, partial residuals of generalized additive model; X‐axis, log of respective feature. Note that regional deviations from classical linear model assumptions are seen.
