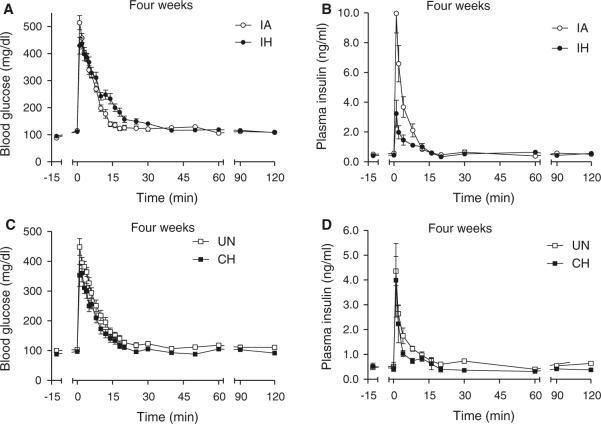
Fig. 4.
FISVGTT after 4-week exposure to IH and CH. Frequently sampled intravenous glucose tolerance test after 4 weeks of exposure in hypoxic and control animals. At time zero, an i.v. injection of 1 g/kg D-50 was administered over a 15-s interval and blood glucose and plasma insulin were sampled over a 2-h period: glucose (a) and insulin (b) curves for the intermittent air (IA) control and intermittent hypoxia (IH) groups; glucose (c) and insulin (d) curves for the unhandled (UN) control and continuous hypoxia (CH) groups

