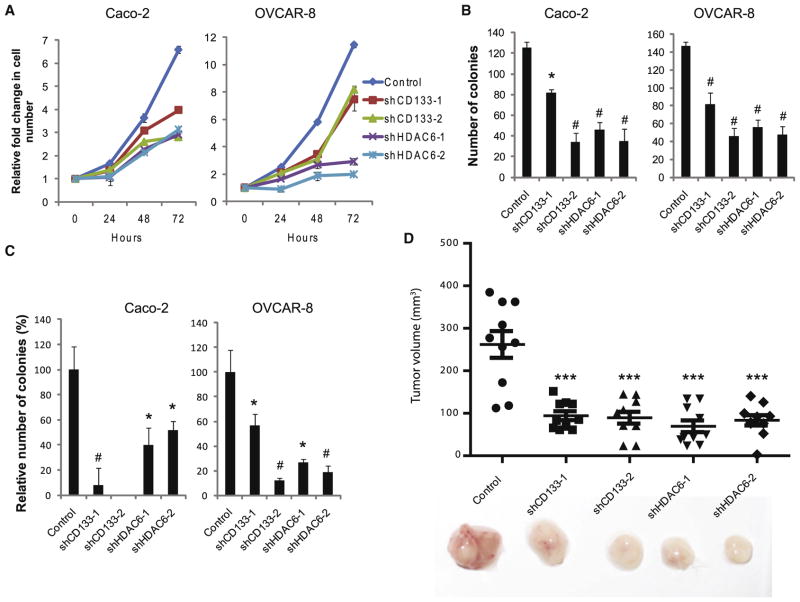
Figure 3. CD133 Promotes Cell Proliferation and Tumorigenesis.
(A) Cell number relative to day 0 for Caco-2 and OVCAR-8 cells treated with control, CD133, or HDAC6 shRNAs. Error bars represent SD (n = 3).
(B) Clonogenic assay of Caco-2 and OVCAR-8 cells treated with control, CD133, or HDAC6 shRNAs. Error bars represent SD (n = 3).
(C) Soft agar colony forming assay to measure anchorage-independent growth of Caco-2 and OVCAR-8 cells treated with control, CD133, or HDAC6 shRNAs. Error bars represent SD (n = 3). *p < 0.05 and #p < 0.01 as determined by a Student’s t test.
(D) Tumor volume 40 days after 5 × 10⁵ shRNA-treated OVCAR-8 cells were subcutaneously implanted in NOD/SCID/IL2Rγ−/− mice. Errors bars represent SEM (n = 10). ***p < 0.001 as determined by analysis of variance (ANOVA).
See also Figure S4.

