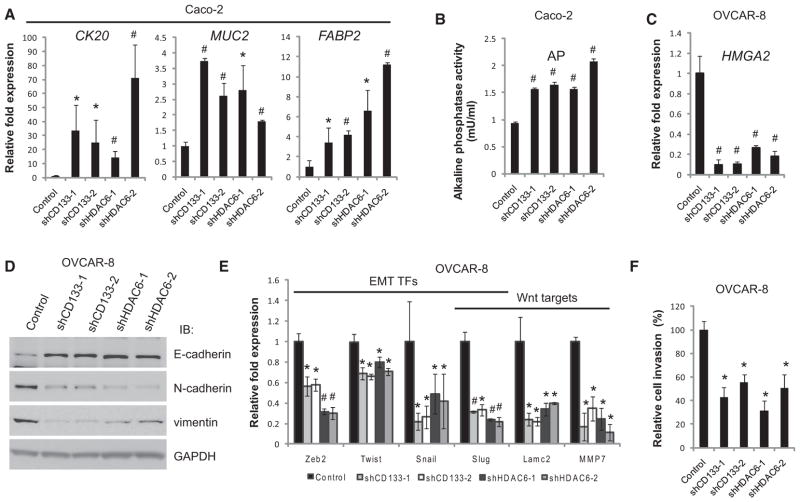
Figure 4. CD133 Suppresses Cancer Cell Differentiation.
(A) Relative transcript levels of epithelial differentiation markers CK20, MUC2, and FABP2 as measured by quantitative PCR of shRNA-treated Caco-2 cells. Error bars represent SD (n = 3).
(B) Activity of the enterocytic marker alkaline phosphatase (AP) following knockdown of HDAC6 or CD133 in Caco-2 cells. Error bars represent SD (n = 4).
(C) Relative transcript levels of the ovarian differentiation markerHMGA2 as measured by quantitative PCR of shRNA-treated OVCAR-8 cells. Error bars represent SD (n = 3).
(D) Western blot analyses for epithelial (E-cadherin) and mesenchymal (N-cadherin and vimentin) markers in OVCAR-8 cells where CD133 or HDAC6 has been knocked down with two independent shRNAs. CD133 and HDAC6 knockdowns are shown in Figure 4D. GAPDH immunoblots served as a loading control.
(E) Quantitative PCR of EMT-associated and Wnt signaling target genes following knockdown ofCD133orHDAC6inOVCAR-8cells. Error bars represent SD(n= 3).
(F) Invasion of basement membrane extract (BME) of OVCAR-8 cells (24 hr assay) treated with shRNAs to knock down CD133 or HDAC6. Cell invasion values are relative to cell invasion of OVCAR-8 cells treated with the control shRNA targeting a nonhuman transcript, LacZ. Error bars represent SD (n = 3). *p < 0.05 and #p < 0.01 as determined by a Student’s t test.
See also Figure S5.

