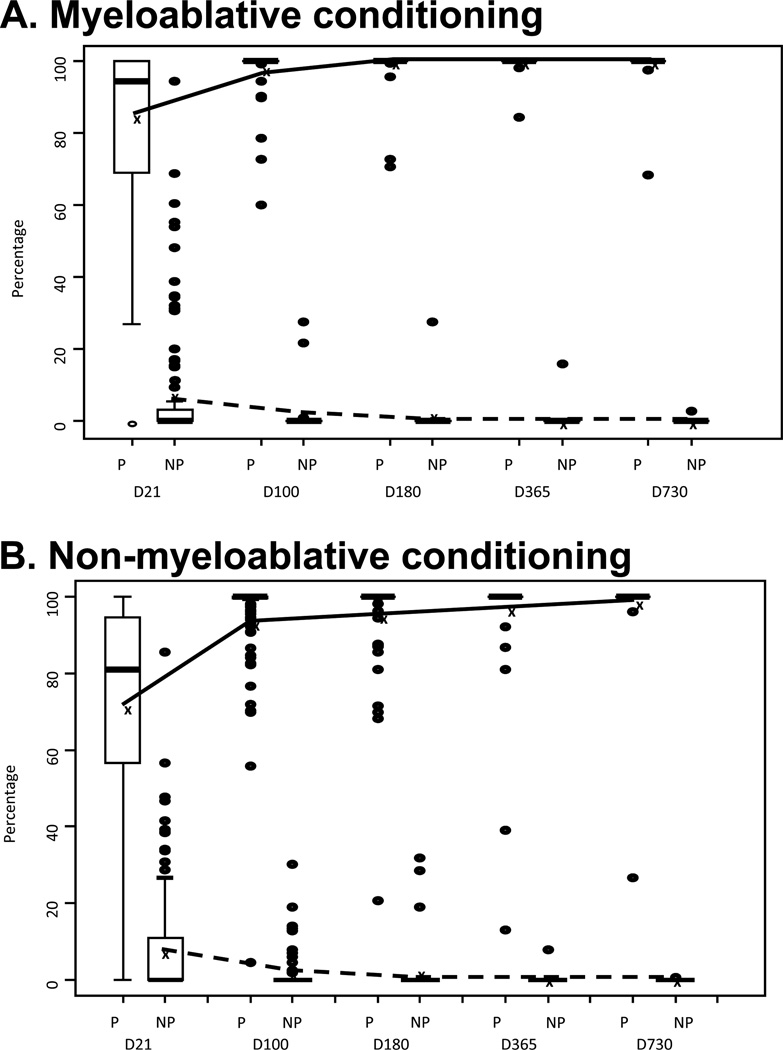
Figure 1.
Chimerism kinetics of predominant and non-predominant UCB units in patients receiving myeloablative (A) and non-myeloablative (B) conditioning. The box represents the interquartile range and median, and the dots represent the extreme values in the data set. The lines represent the mean percentage of chimerisms of the predominant (solid) and non-predominant (dashed) units for each time point after transplant. The box representing the interquartile range is not visible for Day 100 and later time points due to minimal data distribution.

