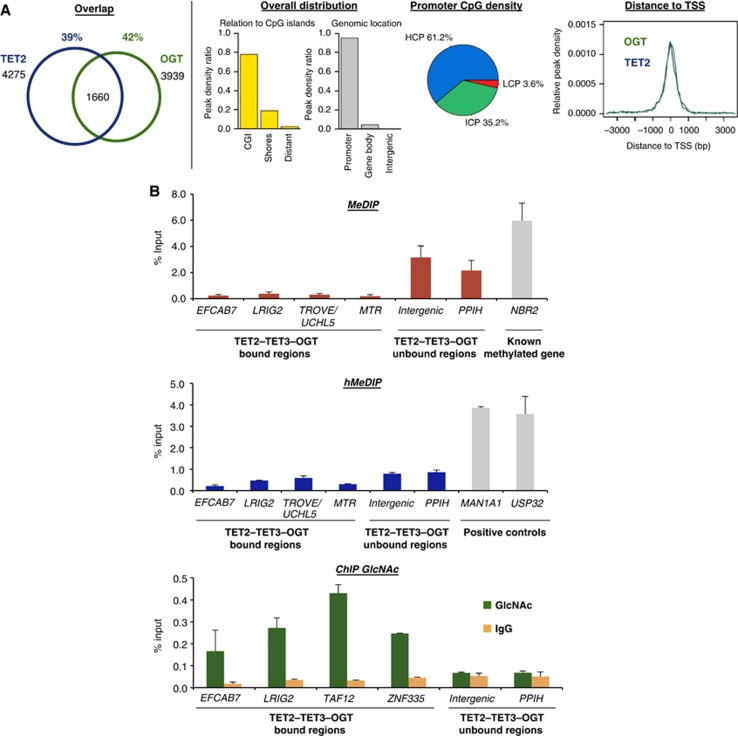
Figure 2.
TET2/3–OGT show genomic co-localization around TSSs and impact on H3K4me3 and transcriptional activation. (A) Left: Venn diagrams indicating significant overlap of TET2 and OGT bound regions (left part; P-value<10−10) identified after HaloCHIP-Seq in HEK293T cells expressing HT-TET2, or HT-OGT. Right: TET2–OGT targets are primarily found at TSSs and CpG-rich sequences. Similar profiles were also observed for TET3–OGT (Supplementary Figure 8). (B) An analysed subset of TET2–TET3–OGT targets show a lack of DNA methylation and hydroxymethylation, yet display GlcNAcylation. qPCR analysis of TET2–TET3–OGT binding and non-binding regions after MeDIP (top), hMeDIP (middle), or ChIP with an anti-O-GlcNAc antibody (bottom). ‘% Input’ represents real-time qPCR values normalized with respect to the input chromatin. Known methylated and hydroxymethylated regions are shown as positive controls in MeDIP and hMeDIP panels.

