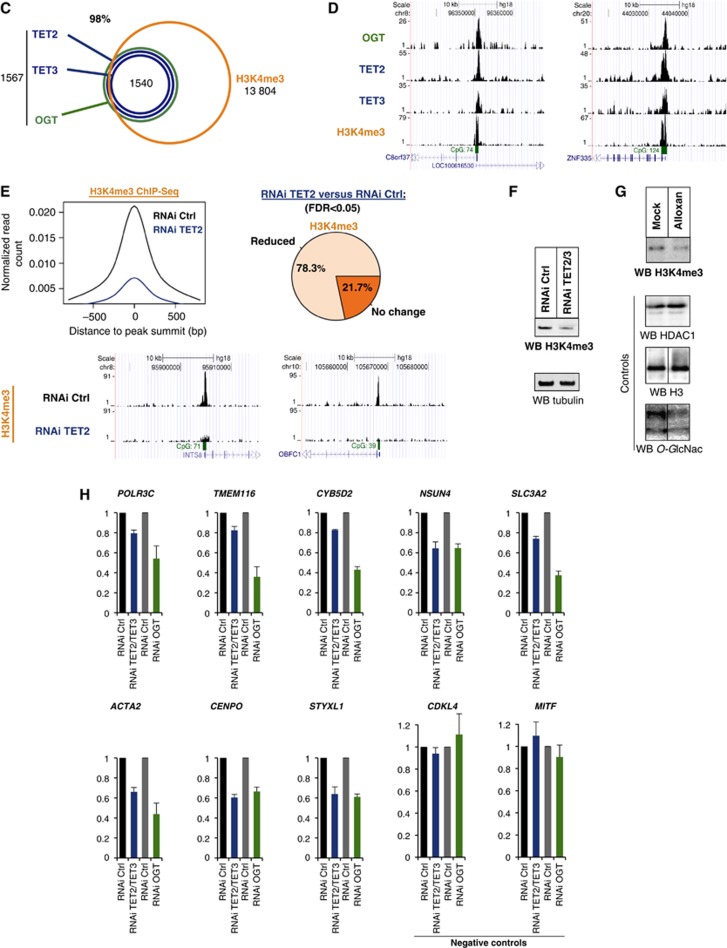
Figure 2.
(C) TET2/3–OGT targets in HEK293T cells are enriched for H3K4me3 as depicted in a Venn diagram; P-value<10−10. (D) Examples of HaloCHIP-Seq OGT, TET2, TET3, and ChIP-Seq H3K4me3 profiles (UCSC tracks). (E) Decreased levels of H3K4me3 in TET2 kd cells. Upper-left: decrease in the normalized number of H3K4me3 reads in TET2/3–OGT-binding regions in TET2 kd cells versus control RNAi-treated cells. Upper-right: pie chart showing the percentage of TET2–TET3–OGT binding regions with a statistically significant reduction of the normalized number of H3K4me3 reads for TET2 kd versus control RNAi-treated cells. Lower-part: examples of H3K4me3 ChIP-Seq profiles (UCSC tracks) in TET2–TET3–OGT-binding regions for the RNAi control versus TET2 kd sample. (F) Western blot showing global decrease in H3K4me3 in a TET2/3 double kd cells. Lysates from mock HEK293T RNAi kd or TET2/3 kd cells were probed for H3K4me3 using an anti-H3K4 antibody in western blot. Tubulin is shown as a loading control. (G) OGT activity is important for H3K4me3. Cell extracts were prepared from HEK293T cells treated with or without the OGT inhibitor Alloxan, and then western blots for H3K4me3 were performed. HDAC1 and H3 are shown as loading controls and a western blot against O-GlcNAc was used to monitor specific GlcNAcylation inhibition by Alloxan. Vertical lines indicate juxtaposition of lanes non-adjacent within the same blot, exposed for the same time. (H) Decreases in transcription are observed in both TET2/3 knockdowns and an OGT knockdown. The indicated target genes (which showed decrease in H3K4me3 after TET2 kd; cf. E) and negative controls (unbound TET2/3–OGT–H3K4me3 targets), were analysed by RT–qPCR in HEK293T cells subjected to the various listed RNAi treatments. Independent experiments were performed in duplicates.

