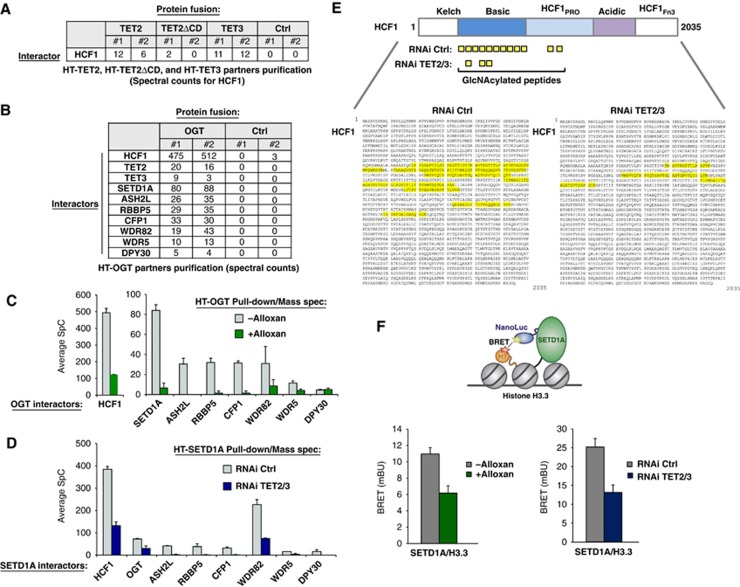
Figure 3.
TET2/3 promotes GlcNAcylation of HCF1, and both TET and OGT activity favour the integrity of SET1/COMPASS and SETD1A binding to chromatin. (A) Mass spectrometry reveals HCF1, a known target of OGT (Wysocka et al, 2003) and component of SET1/COMPASS (Lee et al, 2010), as an interacting partner of HT-TET2 and HT-TET3. Biological duplicates and respective spectral counts (SpC) for HCF1 are shown. (B) Protein pulldowns of HT-OGT coupled with mass spectrometry identify HCF1, TET2, TET3, and all components of SET1/COMPASS as partners of OGT. Biological duplicates and SpC for each protein identified are shown for HT-OGT and Ctrl isolations. (C) The interaction of HCF1 and SET1/COMPASS components with HT-OGT depends on O-GlcNAc activity. Plot showing average SpCs for HCF1 and SET1/COMPASS components isolated from HT-OGT pulldowns of untreated (grey bars) and Alloxan-treated (green bars) HEK293T cells. Error bars represent s.d. of biological duplicates. Representative NSAF plots are shown in Supplementary Figure 11. (D) The interaction of HT-SETD1A with SET1/COMPASS components and OGT is reduced by a TET2/3 double kd. Plot showing average SpCs for SET1/COMPASS components and OGT isolated from HT-SETD1A pulldowns of control RNAi-treated (grey bars) and TET2/3 kd (blue bars) HEK293T cells. Error bars represent s.d. of biological duplicates. Representative NSAF plots are shown in Supplementary Figure 11. (E) A significant reduction in HCF1 GlcNAcylation is observed after TET2/3 double kd. Upper diagram shows a schematic representation of full-length HCF1 and its domains (Capotosti et al, 2011). The GlcNAcylated peptides identified by mass spectrometry from HT-SETD1A isolations from control RNAi-treated and TET2/3 kd cells are indicated below. The full-length HCF1 amino-acid sequence (NP_005325.2) shows the corresponding GlcNAcylated peptides highlighted in yellow with RNAi Ctrl on the left and RNAi TET2/3 kd on the right. (F) Bioluminescence resonance energy transfer (BRET) assays show reduction of SETD1A binding to histone H3.3 in the presence of an OGT inhibitor and in TET2/3 kd cells. Upper diagram showing the schematic of BRET energy transfer upon binding of a NanoLuc-SETD1A fusion donor and fluorescently labelled Histone H3.3-HaloTag fusion acceptor in live HEK293T cells (see Materials and methods for experimental details and calculation of BRET). Left: BRET measurements were calculated without treatment (grey) or with Alloxan treatment (green). Right: BRET measurement for RNAi control (grey) or RNAi TET2/3 (blue). Biological triplicates ±s.d. are shown.

