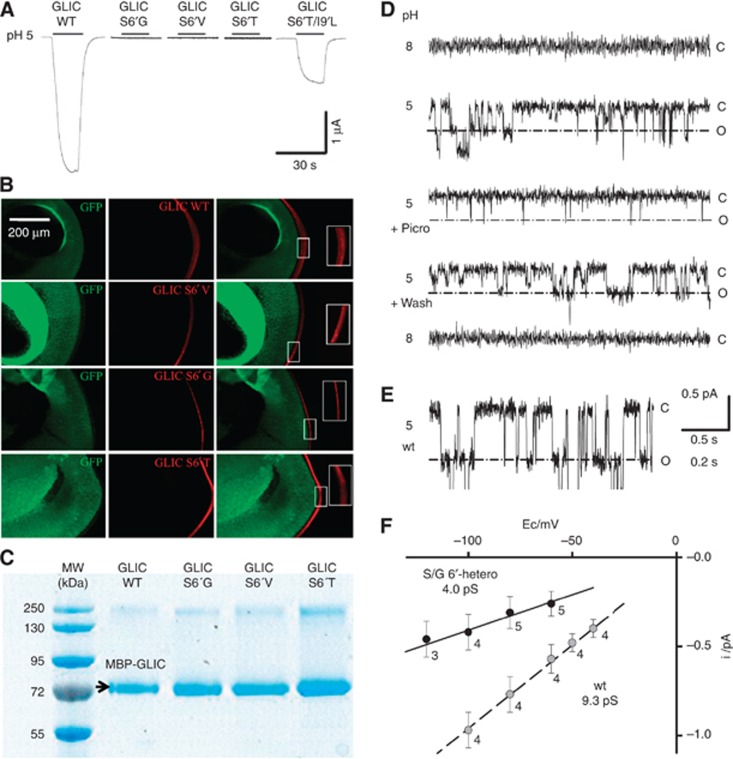
Figure 4.
Electrophysiology of Ser6′ mutants. (A) Voltage-clamp current traces recorded from GLIC wt and the S6′G, S6′T, S6′V and S6′T/I9′L variants expressed in Xenopus oocytes, showing the effect of switching extracellular pH from 8 to 5. (B) Immunofluorescence microscopy data showing that all GLIC variants express at the oocyte surface. (C) SDS denaturating gel experiment in reducing conditions showing that all GLIC variants express in E. coli. (D) Traces of currents recorded from an outside-out patch from BHK cells transfected with a mixture of cDNAs coding for GLIC S6′G and GLIC wt, in a 4 to 1 S6′G to wt DNA ratio (a=0.8). Currents recorded at extracellular pH 8 (upper trace), then pH 5, then pH 5 with 0.1 mM picrotoxinin, pH 5 after toxin wash-out, and pH 8, on the same patch. Holding potential −100 mV. The patch input resistance was 0.6 tΩ (closed level at pH 5). The current levels indicated right to the traces correspond to all channels closed (c), and to one channel open (o) for the prominent, large conductance events measured in F (4 pS), arising from S/G6′-heteropentamers. (E) Trace of current recorded from an outside-out patch from a cell expressing wt GLIC channels. Holding potential of −80 mV. The lower part of the recording has been skipped out from 1.4 pA under the closed channel current level, in order to emphasize the one open channel level for wt GLIC. (F) Plots of single-channel current versus holding potential values, for wt GLIC (grey circles) and for GLIC S/G6′-heteropentamers (black circles) corresponding to the open level emphasized in (D). Number of patches and error bars indicating standard deviations are shown for each voltage. Data were accumulated from four patches (wt), and from eight patches from cells with a=0.8 or a=0.94.

