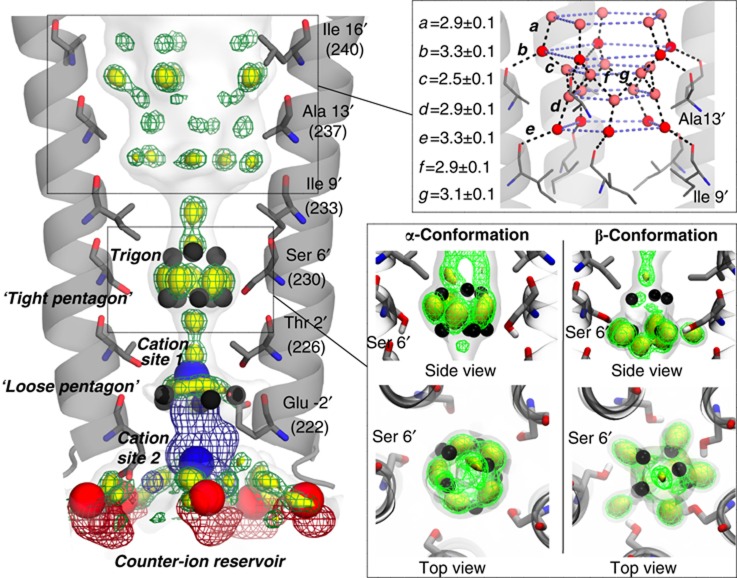
Figure 5.
Ion atmosphere and water binding sites predicted by full-atom MD. Enlarged representation of the pore showing the averaged densities calculated over 200 ns for water molecules (green mesh and yellow surface contoured at increasing density starting from the bulk density shown as white transparent surface), Na+ (blue mesh) and Cl− (red mesh). For comparison, experimentally observed water molecules, anions and cations are shown as cpk spheres (coloured in black, red and blue, respectively). (Right bottom panel) Comparing the hydration profile observed when the side chain of Ser6′ adopts an α or a β conformation (see Supplementary Information for details). (Right top panel) Detailed view of the network of water molecules that covers the edges of the hydrophobic half of the channel (distances are measured in Å). Primary and secondary layers of water molecules are shown as red and pink spheres, respectively.

