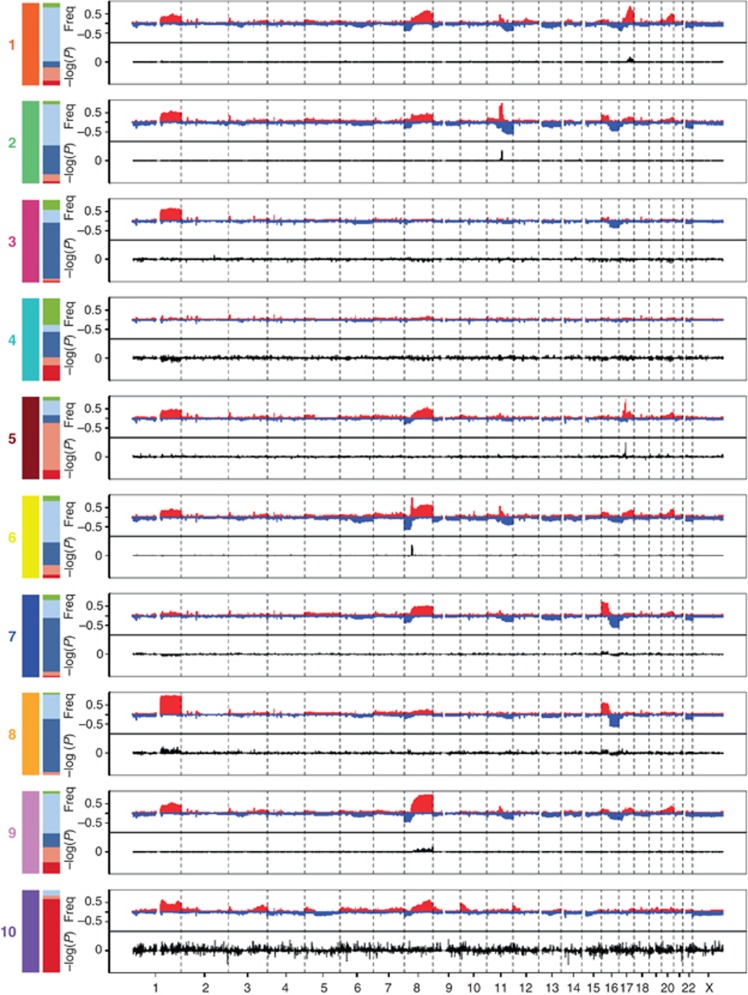
Figure 1.
The genomic and transcriptomic landscape of the 10 integrative clusters. Genome-wide frequencies (Freq) of somatic copy number alterations (Y axis, upper plot) and the subtype-specific association (−log10 P-value) of gene expression (Y axis, bottom plot) based on the differential expression in each of the 10 integrative clusters compared to the rest. Regions of copy number gain are indicated in red and regions of loss in blue in the frequency plot (upper plot). Overexpressed genes are represented as positive and underexpressed genes as negative (lower plot). The left bars show the composition of each cluster in terms of the intrinsic subtypes (red: basal, pink: HER2, dark blue: luminal A, light blue: luminal B and green: normal-like).

