Figure 4.

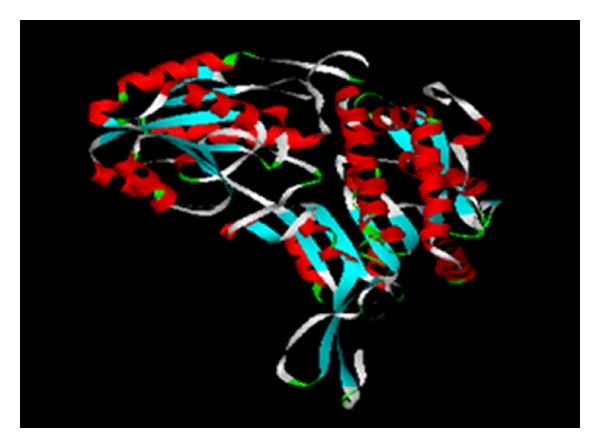
SAM-T08 model of GAPN and visualized by ViewerLite. Red representing alpha helix, sky blue representing beta sheet, and green representing loop in model.

SAM-T08 model of GAPN and visualized by ViewerLite. Red representing alpha helix, sky blue representing beta sheet, and green representing loop in model.