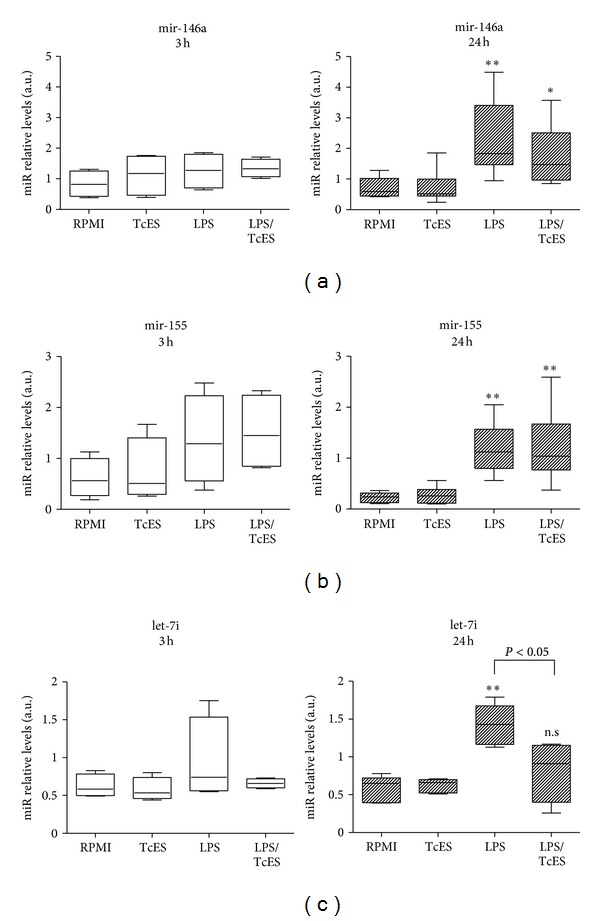
Figure 2.

Expression of miRNAs mir-146a, mir-155, and let-7i in human DCs activated with LPS and exposed to excreted/secreted T. crassiceps antigens. The miRNAs expression was evaluated after stimulation of human DCs with 20 ug/mL TcES, 1 ug/mL LPS, or a combination of them for 3 or 24 h. Control cells received RPMI. Determination of miRNAs relative levels by qRT-PCR was conducted using mature miRNAs specific TaqMan assays in cultures from nine independent experiments (4 donors for 3 h and 5 donors for 24 h). The gene let-7a was used as reference gene and relative quantification was calculated by the formula 2−(CT targetmiRNAs−CT reference). All miRNAs assays were tested for reproducibility and linearity (PCR efficiency was between 1.9 and 2.0 for all assays). The data is shown as boxplot, horizontal line denotes the median value, box encompasses the upper and lower quartiles and the whiskers, and the minimum and maximum data value. The relative expression values were analyzed using the nonparametric Kruskal-Wallis test and Dunn's post hoc comparisons. For (a) y (b) *P < 0.05 and **P < 0.01 versus RPMI control group were deemed significant. For (c) *P < 0.05 for LPS versus LPS/TcES and n.s. for LPS/TcES versus RPMI control group. All analyses were performed with the GraphPad Prism v. 5 statistical software.
