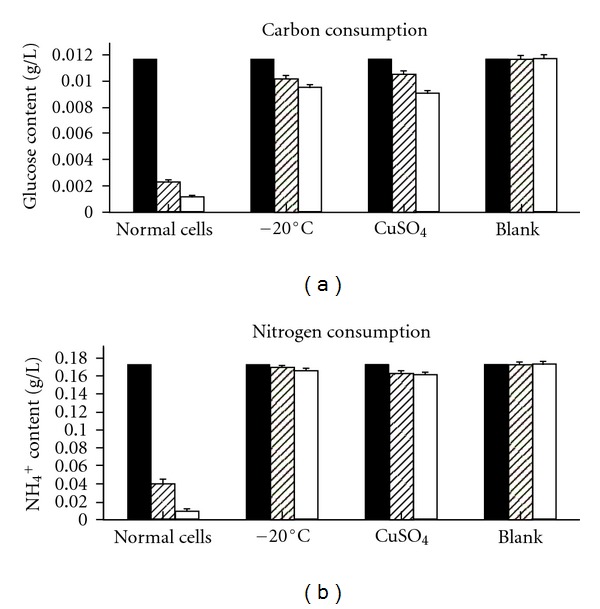
Figure 3.

Metabolic activities of normal cells and VBNC S. typhi cells (induced by −20°C temperature and CuSO4). Glucose content at the baseline time point (black bars above). Glucose content after 24 h (grid bars above). Glucose content after 48 h (white bars above). NH4 + content at the baseline (black bars below). NH4 + content after 24 h (grid bars below). NH4 + content after 48 h (white bars below).
