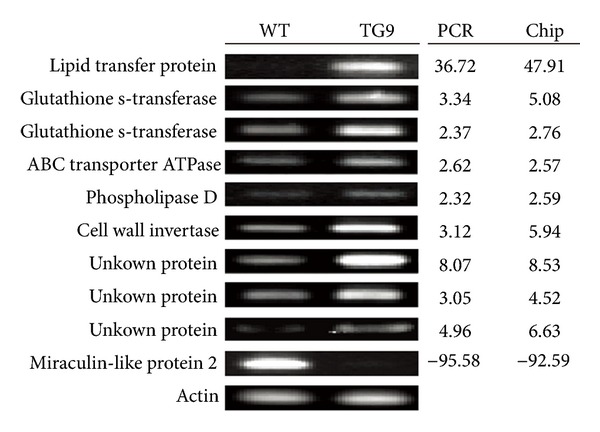
Figure 1.

Validation of microarray results by semiquantitative RT-PCR. Ten probes putatively encoding lipid transfer protein (Cit.60.1.S1_at), glutathione s-transferase (Cit.6308.1.S1_at, Cit.9510.1.S1_s_at), ABC transporter ATPase (Cit.3246.1.S1_at), phospholipase d (Cit.6097.1.S1_s_at), cell wall invertase (Cit.5734.1.S1_at), miraculin-like protein 2 (Cit.57.1.S1_at) and unknown protein (Cit.19313.1.S1_at, Cit.5367.1.S1_at, Cit.1406.1.S1_s_at) were amplified with specific primers in WT and TG9 leaves, using Actin gene as an internal control for examining equal cDNA loading. The expression ratios between TG9 and WT were calculated by quantifying the band density using the Quantity One software.
