
Figure 2.
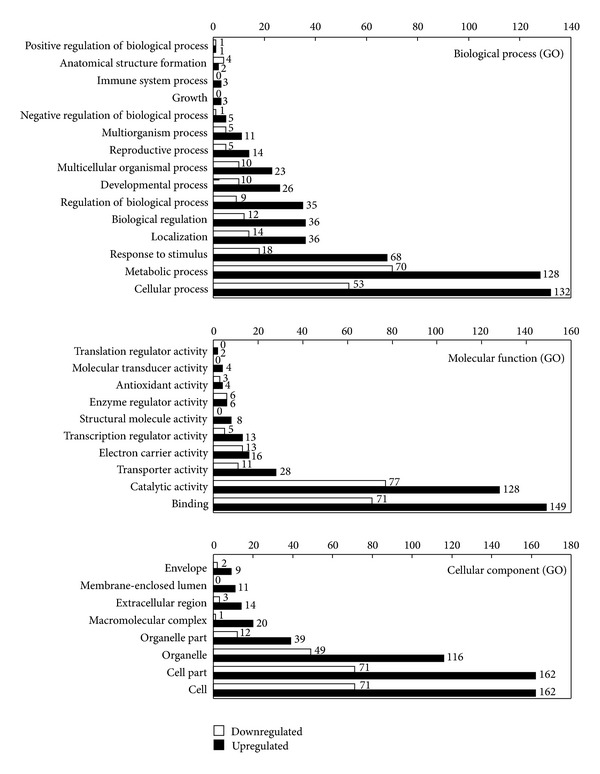
Functional categorization of upregulated and downregulated differentially expressed genes. 448 significantly upregulated and 218 significantly downregulated DEGs were categorized to biological process, molecular function, and cellular component based on GO annotation, and the represented number of each column was marked in the figure.