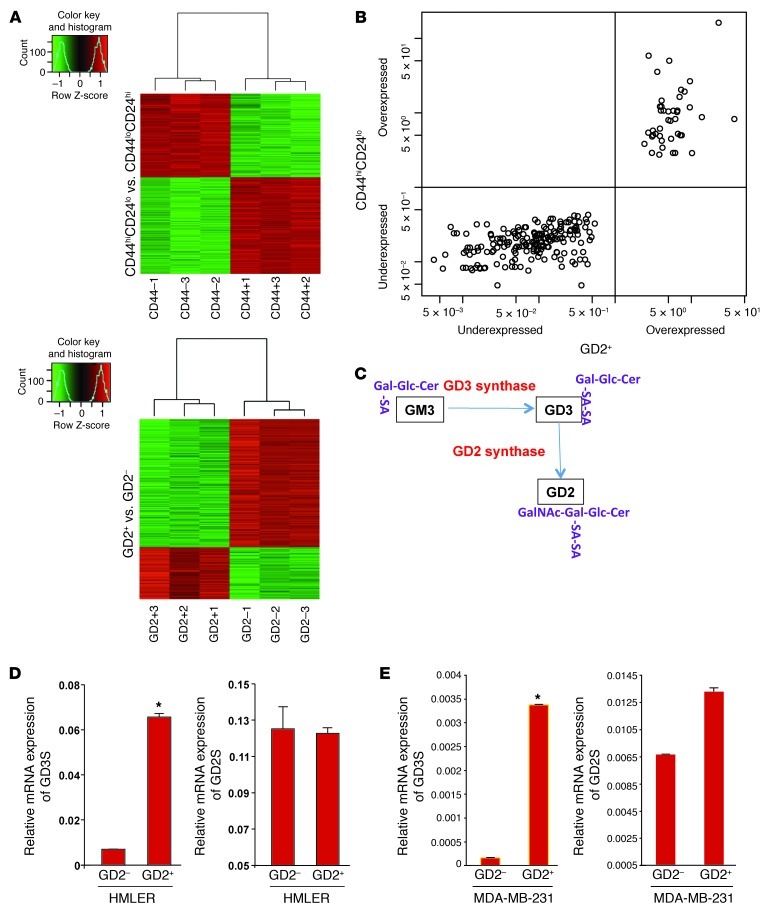
Figure 3. GD2+ and CD44hiCD24lo cells have a similar gene signature.
(A) Heat maps derived from microarray analysis of CD44hi/loCD24lo/hi and GD2+/– populations of HMLER cells. (B) Two hundred thirty-one genes of the top 600 differentially expressed genes were identical in GD2+ versus GD– and CD44hiCD24lo versus CD44loCD24hi groups. These genes were cross-classified in a 2-by-2 table by GD2+ up-/downregulation and CD44hiCD24lo up-/downregulation. Pearson’s χ2 test with a Yates continuity correction was applied to assess the association. Statistical significance was assessed at the 0.05 level. (C) Biosynthesis reaction of GD2. (D and E) To measure the expression of GD2S/GD3S mRNA, CD44hiCD24lo or CD44loCD24hi and GD2+/– cells from HMLER (D) or MDA-MB-231 cells (E) were FACS sorted, and mRNA was analyzed using qRT-PCR. *P < 0.001.

