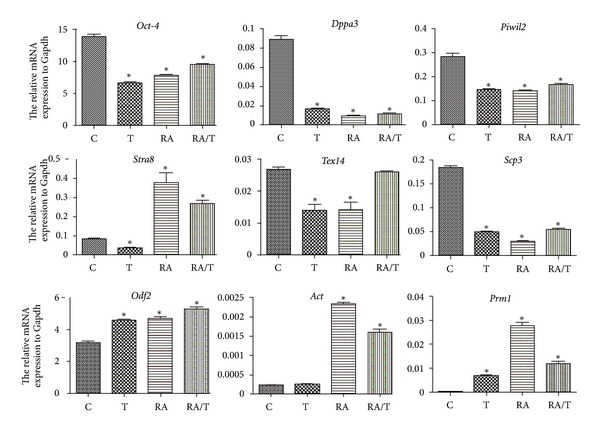
Figure 4.

The expression profiles of germ cell-associated genes in iPS cells treated with RA or testosterone in vitro. qPCR was carried out using the cDNA of iPS cells in the presence or absence of RA and testosterone. The mean normalized expression of each gene relative to that of Gapdh was shown along the y-axis. C: the control group without retinoic acid or testosterone induction. T: the testosterone induction group. RA: the retinoic acid induction group. RA/T: the retinoic acid and testosterone induction group. Note: *indicated statistically significant differences (P < 0.05) in the mRNA expression between the RA- or testosterone-treated groups and the control.
