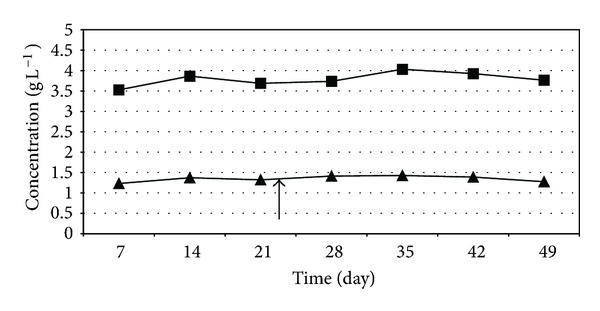
Figure 10.

Volatile fatty acid levels during the thermophilic biogas intensification experiment. C. saccharolyticus was added at the time point indicated by the arrow. ■—acetate concentration, ▲—propionate concentration. Feeding rate: 8 g total organic solids L−1 day−1.
