Figure 9.

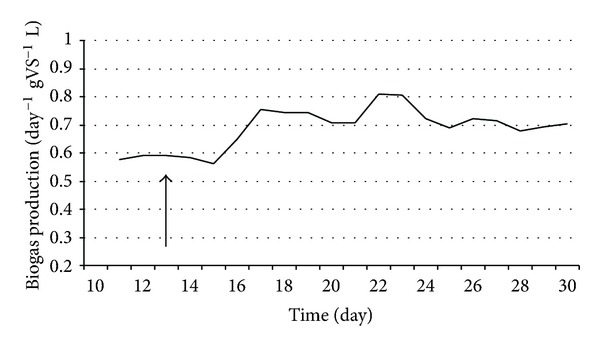
Biogas production in CSTR reactors. E. cloacae was added at the time point indicated by the arrow. Feeding rate: 8 g total organic solids L−1 day−1.

Biogas production in CSTR reactors. E. cloacae was added at the time point indicated by the arrow. Feeding rate: 8 g total organic solids L−1 day−1.