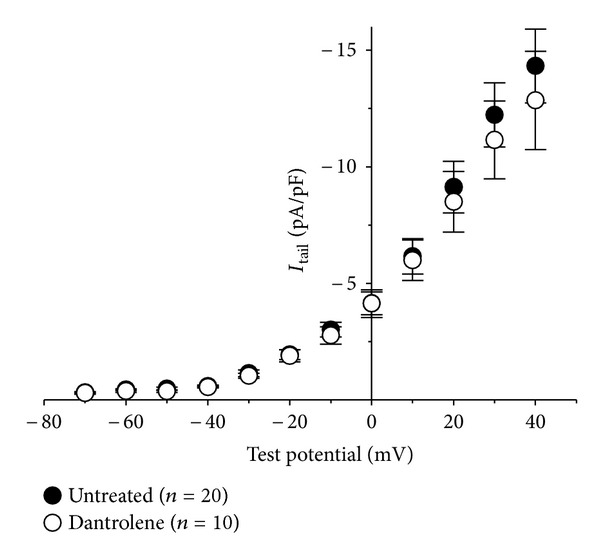
Figure 3.

Tail current analysis. (a) Comparison of peak I-V relationships for control (⚫; n = 20) and Dantrolene-treated (⚪; n = 10) myotubes. Tail currents were elicited by repolarization from the indicated test potential to −80 mV. Currents were evoked at 0.1 Hz by test potentials ranging from −70 mV through +40 mV in 10 mV increments. Peak tail current amplitudes were normalized by linear cell capacitance (pA/pF).
