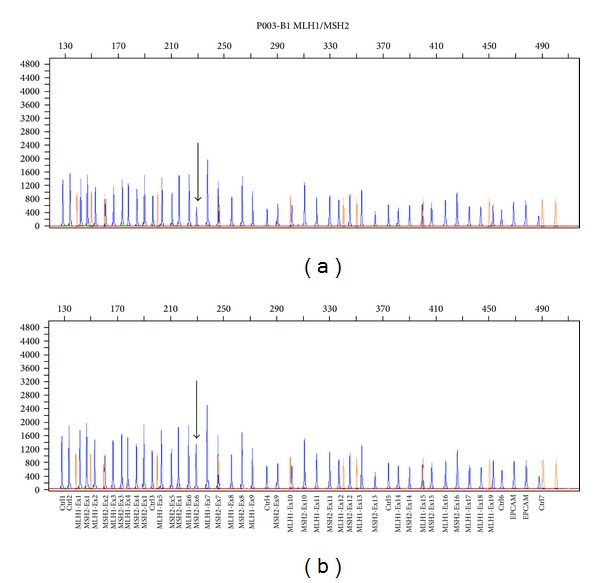
Figure 1.

MLPA analysis reveals a candidate genomic rearrangement in the MSH2 gene. (a)The electropherogram of the DNA patient: the arrow shows half the level of amplification of exon 6 in the carrier subject. (b) The electropherogram of the DNA healthy control: the arrow shows normal level of amplification of exon 6.
