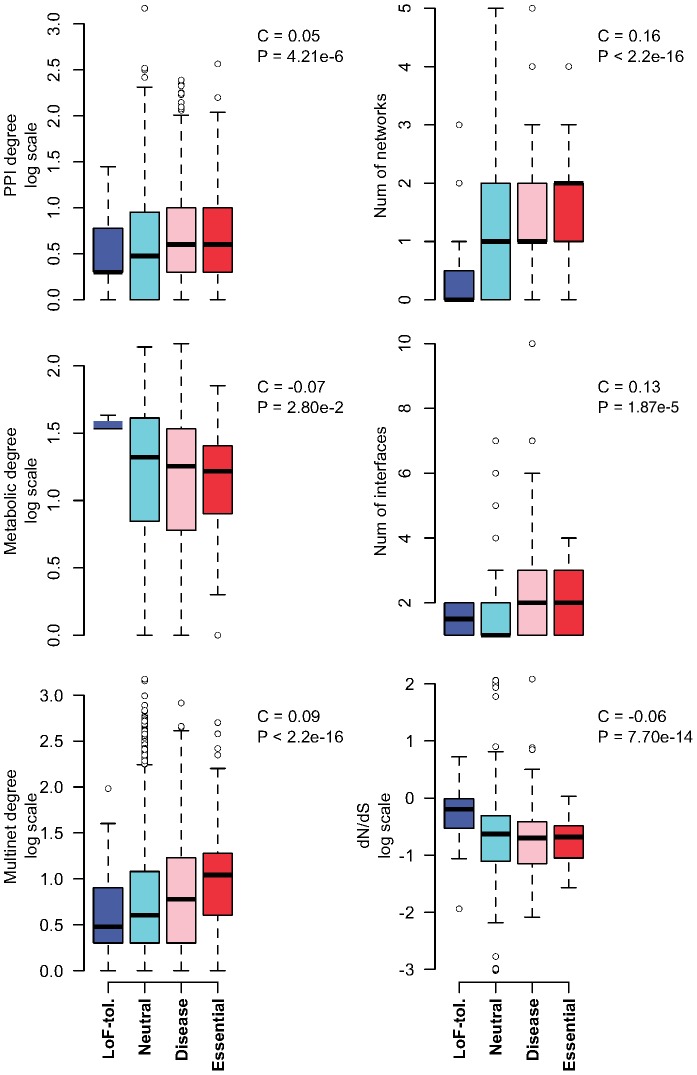
Figure 1. Distributions of various network and evolutionary properties for the four gene categories: LoF-tolerant (blue); neutral (cyan); with known disease-causing mutations (pink) and essential (red).
Spearman correlation coefficients (C) between the corresponding property values of all genes with the gene significance scores are shown at the top right of each boxplot. Corresponding pvalues (P) are also shown.

