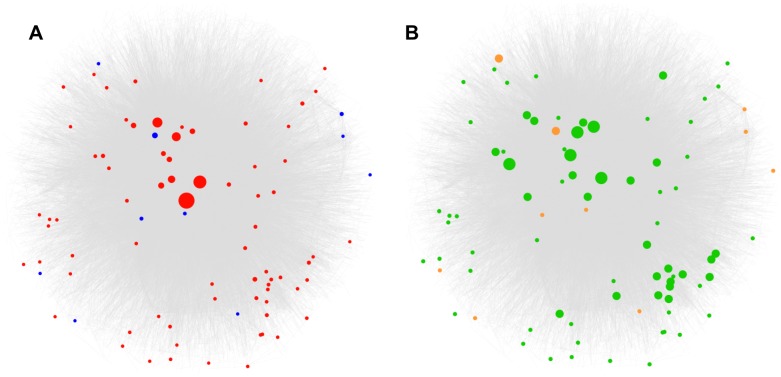
Figure 2. This figure shows the edges (grey) of the Multinet, which correspond to interactions between genes.
Only the interactions of genes that are involved in more than one network are shown for clarity. (A) Nodes corresponding to LoF-tolerant and essential genes are shown in blue and red respectively. Size of the nodes is scaled based on the degree centrality of the gene in Multinet. Essential genes tend to be bigger and in the center while LoF-tolerant genes tend to be smaller and on the periphery. (B) Nodes corresponding to LoF-tolerant and essential genes are shown in orange and green respectively. Size of the nodes is scaled based on the number of networks the gene is involved in. Essential genes tend to be involved in more networks and hence are bigger while LoF-tolerant genes are smaller. Most LoF-tolerant genes are not involved in any network and are not present in the Multinet.

