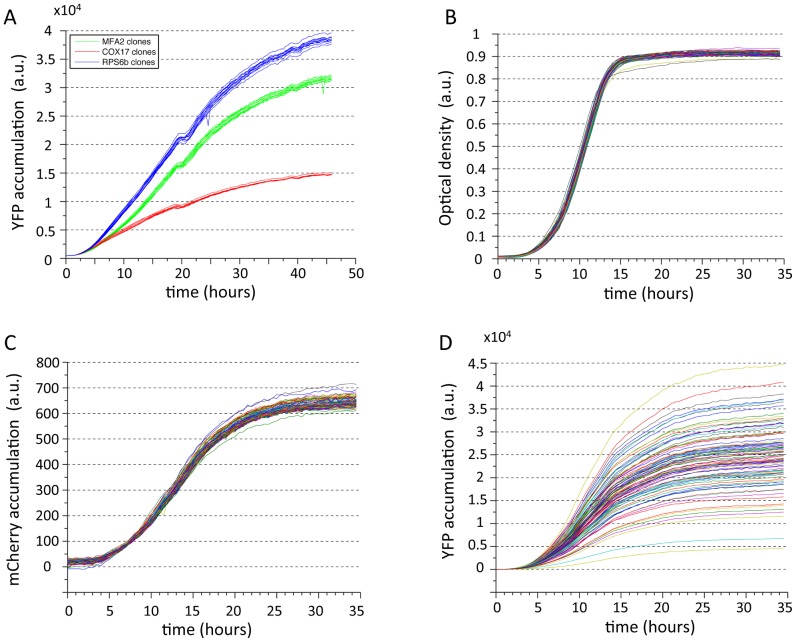
Figure 2. Effect of the 3′ end sequences on YFP accumulation in batch measurements.
(A) YFP measurements of clones with three different 3′ end sequences. Shown are YFP measurements of three different strains, each with a unique 3′ end sequence. Lines of the same color represent measurements of different clones from the same type of 3′ end sequence, demonstrating that the effect of the different constructs on expression is above the variability of our experimental system. The lowest expressing strain (red) contains the COX17 3′ end and serves as a positive control for our experimental system. (B,C,D) Plate fluorometer measurements over time. Following inoculation of the cells in a fresh media containing 2% galactose, optical density (OD), mCherry and YFP are measured over time (B,C and D respectively). Note that as expected, OD and mCherry measurements remain highly similar between different library strains, while YFP expression varies considerably.

