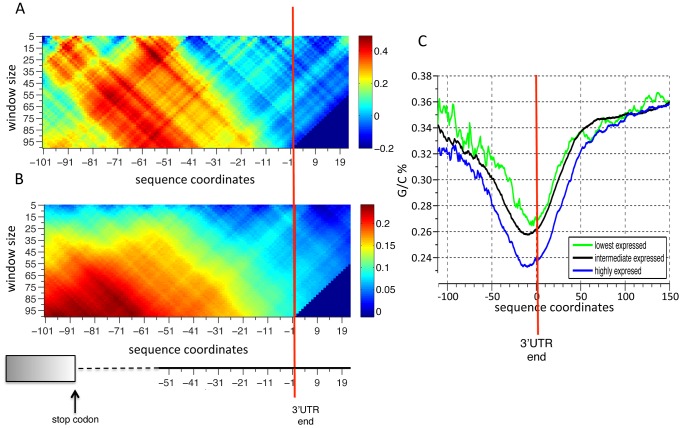
Figure 4. Higher A/T content upstream of the polyadenylation site is associated with higher YFP expression.
(A) The correlation between A/T content and YFP levels in different window sizes and different locations with respect to the main polyadenylation site. Each point in the matrix represents a different window size (y-axis) centered on a different location (x-axis) with respect to the polyadenylation site. Colors represent the Pearson correlation coefficient (side bar). (B) Same as A using genome wide sequence and mRNA levels [6] data. (C) Shown is the average G/C content of three sets of genes grouped by their mRNA expression levels (0.2 percentile of the lowest and highest expressing genes and the intermediate group contains all the rest) as a function of the distance from mapped transcription end sites, in windows of 20 bp centered around each point.

