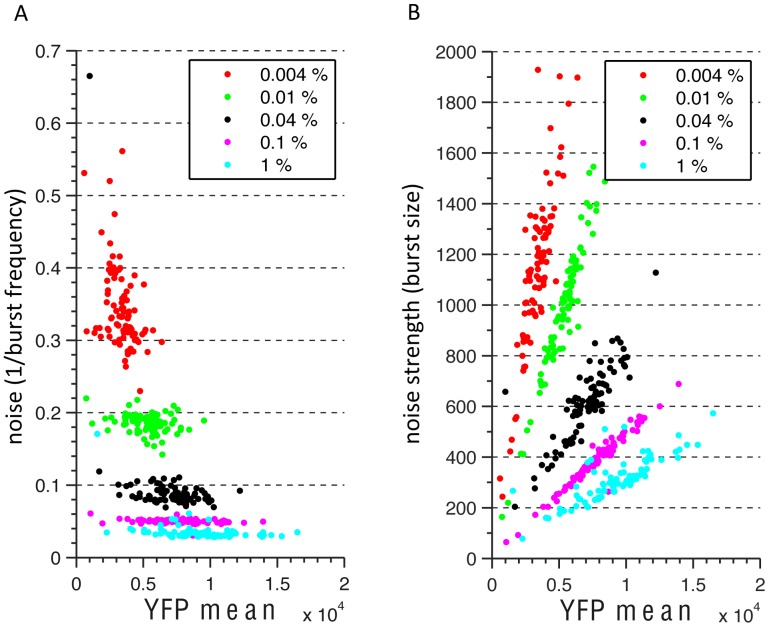
Figure 5. YFP expression is correlated with noise strength.
(A) For several different galactose concentrations (represented by different colors), shown is the YFP expression of each 3′ end library strain (x-axis) versus its noise (y-axis, expression variance divided by mean expression squared). Each point represents the noise computed from single cell flow cytometry measurements of the corresponding 3′ end strain. (B) Same as panel (A) only with noise strength (expression variance divided by mean expression) on the y-axis.

