
Figure 5. Opening pockets shifts the conformational ensemble towards inhibitor-bound structures.
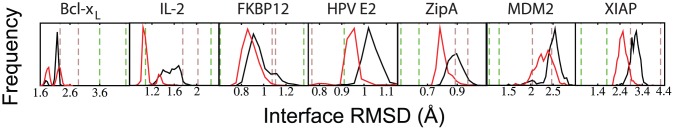
Distributions of RMSD over interface atoms (iRMSD) to the closest inhibitor-bound crystal structure for conformations generated with (red lines) or without (black lines) the biasing potential. The iRMSDs from the unbound structure to the most and least similar inhibitor-bound crystal structures are also indicated (dashed brown vertical lines). For all seven proteins comprising the test set, the biased simulations produced conformations closer to an inhibitor-bound crystal structure than the unbiased simulations.