
Figure 6. Distinguishing druggable from functional sites on survivin.
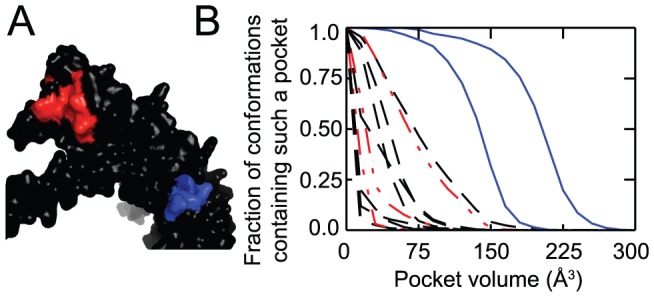
(A) The crystal structure of survivin, showing the protein interaction site (red) and the distal druggable site identified by NMR (blue) [14]. (B) Volumes of surface pockets are compared for conformations generated with the biasing potential applied at random surface residues (dashed black lines), applied at the protein interaction site (dashed red lines), and applied at the distal druggable site (solid blue lines). Pockets emerge at the druggable site but not elsewhere on the protein surface.