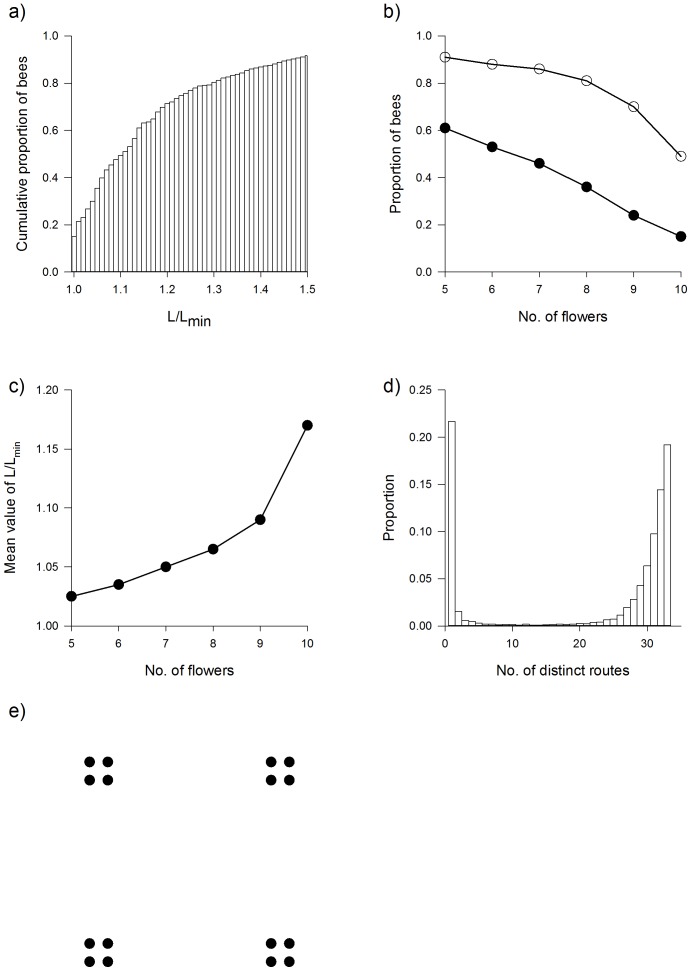
Figure 3. Predicted flight performance in the presence of 10 flowers that are randomly and uniformly distributed within a square patch.
a) Cumulative proportion of model bees with traplines of length L/Lmin is the length of the shortest possible routes between the flowers. b) Predicted optimisation performance of bees in relation to the number of flowers the bees must visit to fill their crop. Proportion of model bees that find solutions to the travelling salesman problem (•) and find good approximate solutions (i.e. have flight lengths that are no more than 10% longer than the shortest possible flights) (○). c) The average value L/Lmin in relation to the number of flowers. d) Distribution of the numbers of distinct routes taken during bouts 33–65 between 10 flowers. e) Schematic of flower array used to evaluate predicted optimization performance of bees foraging for patchily distributed resources.

