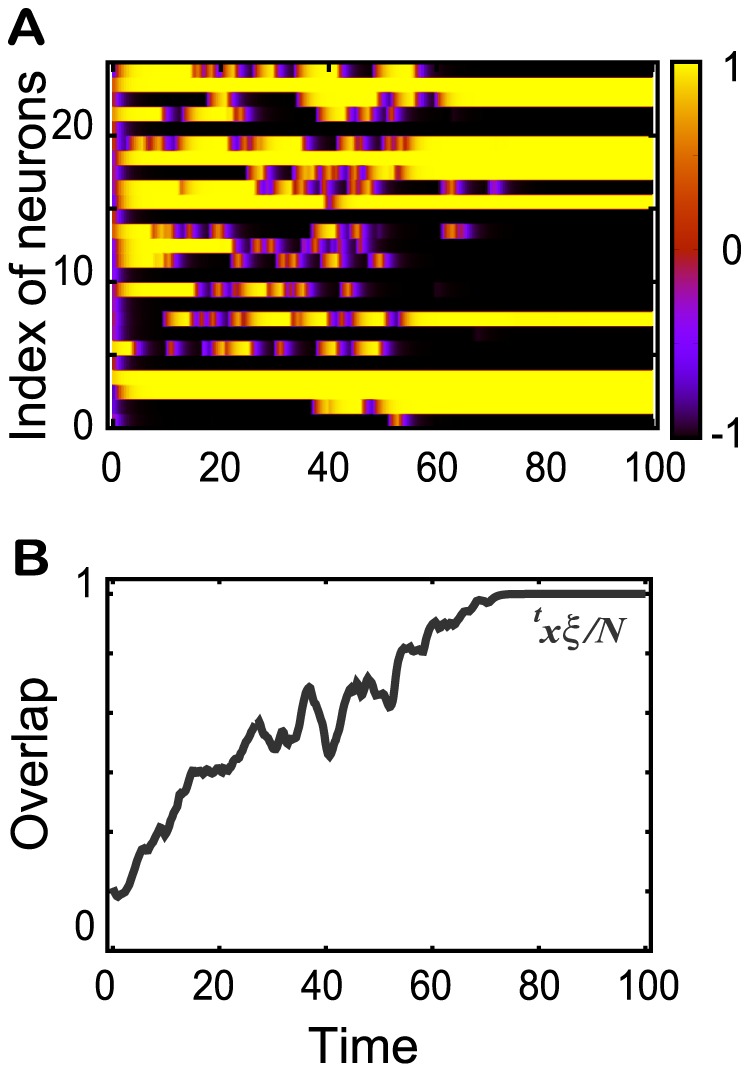
Figure 1. Learning process for one mapping.

A. A raster plot of the activity  for
for  and for 25 of
  neurons. B. The temporal evolution of the overlap with the target
  for the learning process in A.

A. A raster plot of the activity  for
for  and for 25 of
  neurons. B. The temporal evolution of the overlap with the target
  for the learning process in A.