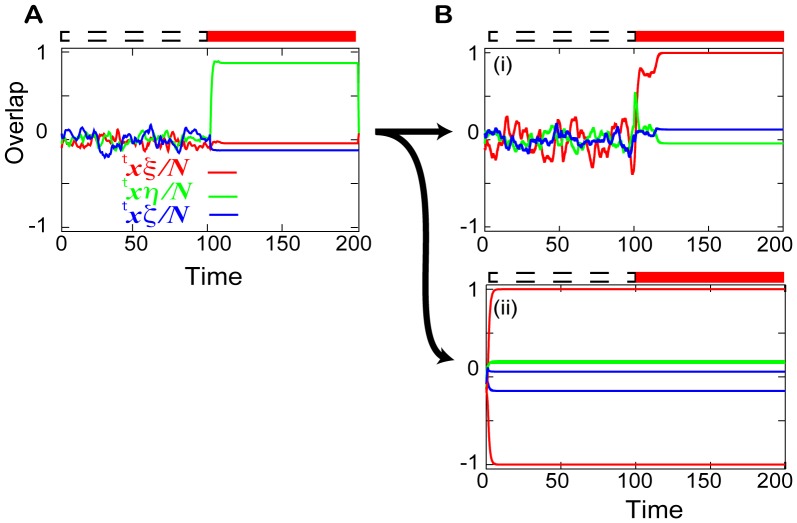
Figure 2. Recall processes before and after the learning.
Neural activities plotted as a time series of the overlaps with the target ( ), the input (
 ), and a random pattern (
 ). The random pattern is generated from the same ensemble of targets and inputs. A. The recall process before the learning for
  . B. The recall processes after the learning for (i)
  = (16,0.01) and (ii)
  = (1,0.5). The activity is spontaneous (
 ) or evoked (
 ) as indicated by the dotted and filled red bars, respectively, above the plots. The evoked activity is introduced by the application of an input of strength
  . In (ii), the time series from two initial conditions that lead to the two different attractors are plotted.

