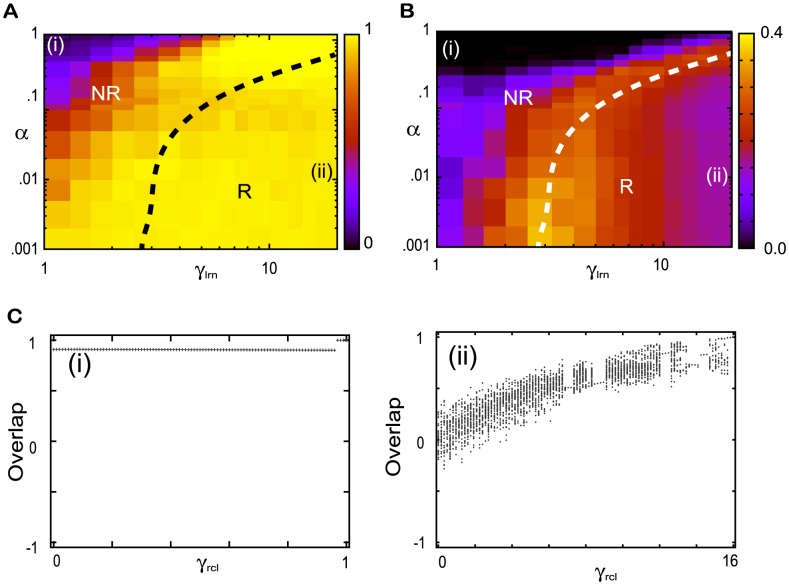
Figure 3. Phase diagram of the evoked and spontaneous dynamics and bifurcation diagram.
A. The quenched average of the overlap with the target  in the evoked dynamics. B. The standard deviation (SD) of the overlap averaged over time and over the networks
  . Average values in A and B are computed over 100 networks and over
  . The dotted curves in A and B, plotted for reference, show the boundary between the R and NR regimes and, which are computed by the ridge of SD in B with smoothing the line. C. The local maxima in the
  time series of the overlap with the target
  as a function of the input strength in (i) the NR regime for
  and (ii) the R regime
  showing the bifurcations.

