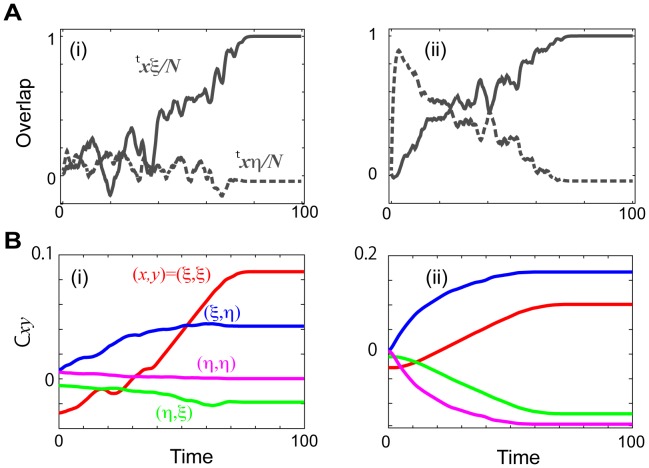
Figure 4. The time evolution of the overlap and the matrix elements.
A. The overlaps with the target  and input
  during the learning process (i) in the NR regime for
  and (ii) in the R regime for
  . B. The matrix elements
  , and
, and  in (i) the NR regime and (ii) the R regime with the same parameters as in A.

