
Figure 8. Bifurcation diagram for (.
 ) = (16,0.01) in the R regime. We use the network shaped after 40 learning steps. A. The local maxima in the
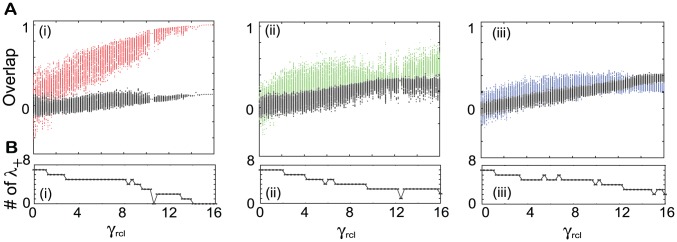
  time series of the overlap with the target
  in the presence of the corresponding input
  as a function of
  . The overlaps with (i) the 1st (
 ), (ii) 5th (
 ), and (iii) 30th (
 ) targets are plotted in red, green, and blue, respectively, while the data in black represent the overlap with each input
  (
( ). B. The number of positive Lyapunov exponents of these evoked dynamics as a function of
  . Lyapunov exponents are calculated from the time series
  according to the algorithm in [56].