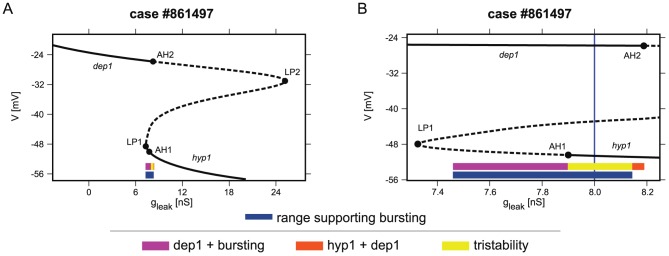
Figure 4. One parameter bifurcation diagram of stationary states of the case #861497 with the marked range supporting bursting.

The bifurcation diagram (A) illustrates tristability. The inset (B) is focused on the range of coexistence of hyp1 and dep1 stationary states and bursting regime. The range of  , where the bursting regime is an attractor, is indicated by a navy blue bar. The magenta bar marks the range of coexistence of the bursting regime and dep1 stationary state. The
  range supporting tristability, where the neuron can exhibit either the bursting regime, hyp1 stationary state, or dep1 stationary state is marked by the yellow bar. The range supporting coexistence of hyp1 and dep1 states without a bursting regime is marked by an orange bar. Notice that the original
  value (8 nS) from the database (indicated by the blue vertical line) belongs to the range supporting tristability.
