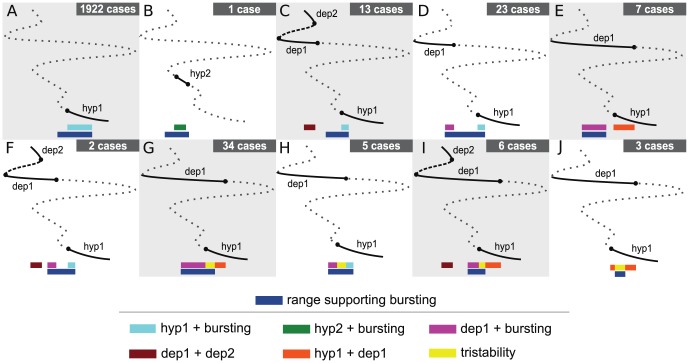
Figure 6. A classification scheme for the cases with multistability.
The bifurcation diagrams describe stationary states branches as the conductance of the leak current is varied and have the ranges supporting bursting marked. There are 10 multistability arrangements classified here: (A) bursting and the hyp1; (B) bursting with hyp2; (C) a range supporting hyp1 and bursting along with a range supporting dep1 and dep2; (D) a range of bistability of hyp1 and bursting along with a range of bistability of dep1 and bursting; (E) one range of coexisting hyp1 and dep1 and one range of coexisting dep1 and bursting; (F) three ranges of coexistence of exactly two regimes: (1) dep1 and dep2, (2) dep1 and bursting, and (3) hyp1 and bursting; (G) one range of tristability along with a range of coexistence of hyp1 and dep1 and a range of coexistence of dep1 and bursting; (H) one range of tristability along with a range of bistability of hyp1 and bursting and a range of bistability of dep1 and bursting; (I) Four ranges of multistability: a range of tristability along with a range of bistability of hyp1 and dep1, a range of bistability of dep1 and bursting, and a range of bistability of dep1 and dep2; (J) two ranges of bistability of hyp1 and dep1 in addition to a range supporting tristability. The solid (dotted) curves represent stable (unstable) branches. The navy blue bar underlies the range supporting bursting activity. The other colored bars mark different types of multistability as indicated in a key.

