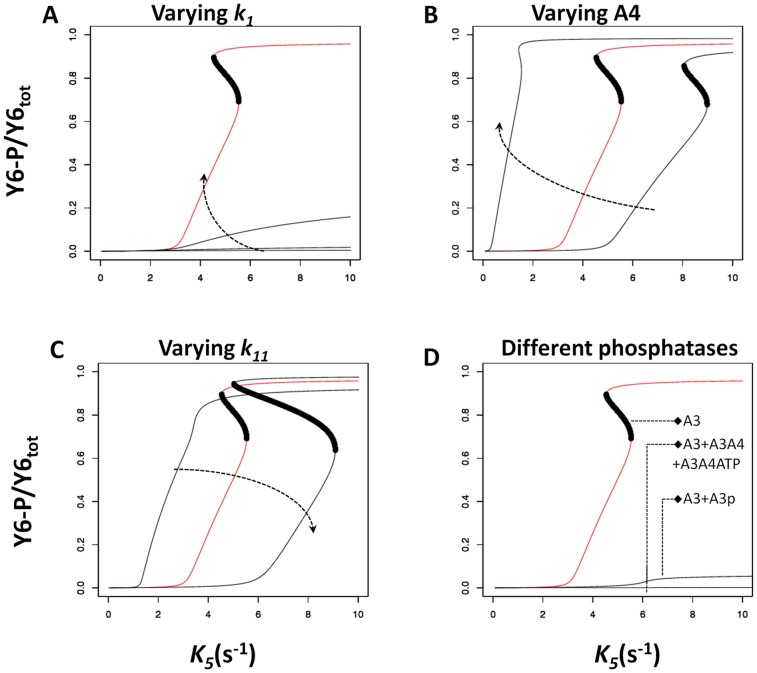
Figure 2. Effects of varying key parameters of the model and addition of different phosphatases.
The x- and y-axis show the signal (k5) level and the corresponding steady state CheY6-P level respectively. Each panel shows a signal-response analysis for varying model parameters (A–C) or the inclusion of additional phosphatases (D). The results of the basic model are shown in red. Where present, the dark region indicates the region of unstable steady states and hence the presence of bistability. Arrows on panels A, B and C indicate increasing value of the changed parameter. (A) The on rate (k1) for CheA3:CheA4 complex formation was varied from basic model value [100(µMs)−1] to 10, 1, and 0.208. (B) Concentration of CheA4 was varied from 30 µM, 40 µM (basic model) and 80 µM. (C) The rate of CheA3 mediated dephosphorylation of CheY6-P (k11) was varied from 1 s−1, 2.5 s−1 (basic model) and 5s−1. (D) The basic model has free CheA3 as the sole phosphatase; the effect of having either CheA3-P or CheA3:CheA4 and CheA3:CheA4:ATP as additional phosphatases is shown. See also Figures S1, S2, S3, S4 for additional sensitivity analyses.

