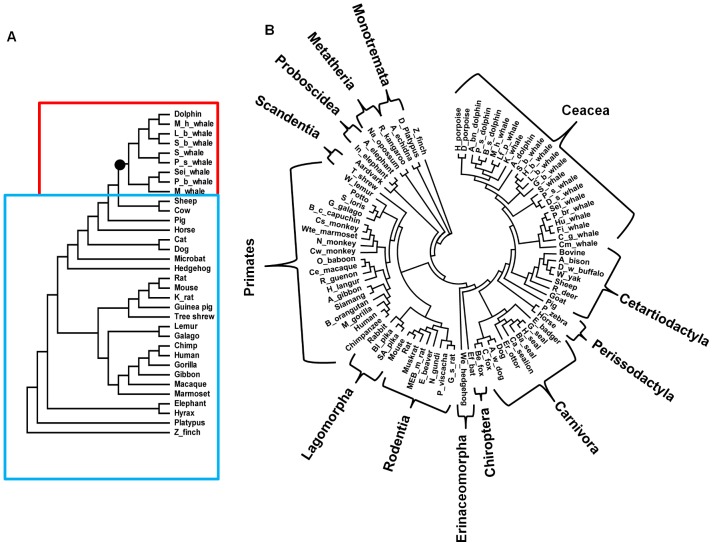
Figure 1. The mammalian phylogenetic tree constructed from A) nucleotide sequences and B) amino acid sequences.
The smaller tree A was used in maximum likelihood tests for adaptive evolution while the tree B was explicitly used for ancestral state reconstruction. The best evolutionary model with the lowest BIC score was Tamura-Nei92 with transition/transversion bias, R = 1.66 in A and Dayhoff in B. Both models allow among-site-rate-variation sampled from a discrete gamma distribution with four categories and shape parameters 0.33 and 0.46 for nucleotide and amino acid sequences respectively. The phylogeny A is divided into two groups of cetaceans (shown in red) and terrestrial mammals (shown in blue) to test the non-uniformity of molecular clock across different lineages and sites. The branch leading to cetaceans is shown with a black circle in Figure 1A.

