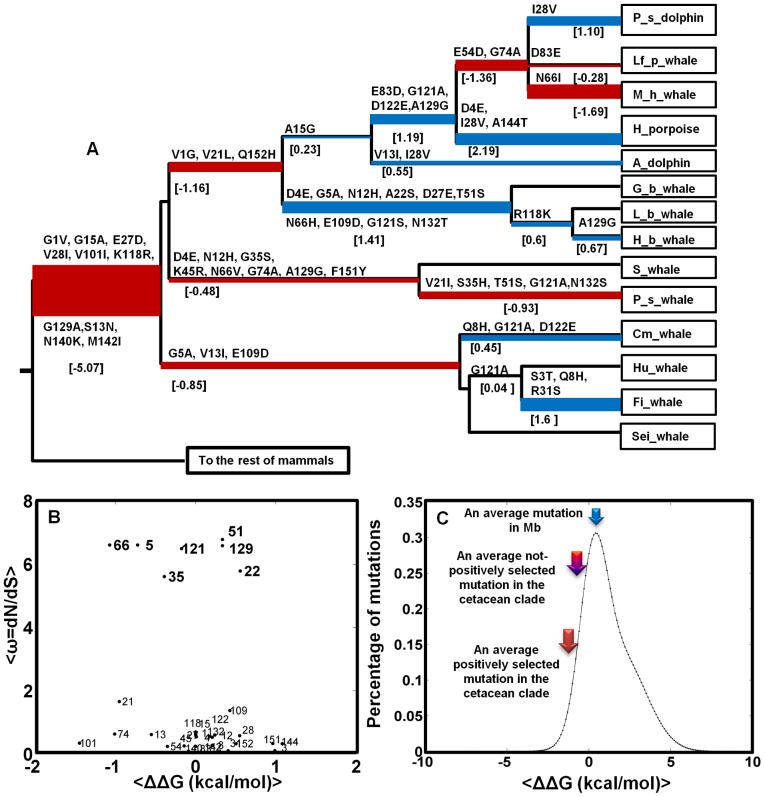
Figure 3. A) The Phylogenetic tree of cetacean Mb upon the divergence from terrestrial counterparts.
Ancestral states were inferred using the maximum likelihood (ML) approach described in Methods [59]. Amino acid changes in each branch are shown with the respective changes in free energy of folding, ΔΔG in kcal/mol calculated from the FoldX force field [28]. Stabilization and destabilization is presented by red and blue colors respectively across the phylogeny, with branch height proportional to |ΔΔG| of that specific branch. B) The average ω = dN/dS for the variable sites in A from the M8 model is plotted versus the average ΔΔG of mutations in these sites. C) The distribution of mutational effects in Mb from [36] is shown with the solid black line where arrows show the average ΔΔG for an average mutation in Mb (∼1.22 kcal/mol), in the cetacean clade among not-positively selected mutations (∼0.06 kcal/mol) and, among the positively selected residues (∼−0.26 kcal/mol). The probability of stabilization caused by positive selection is ∼0.8.

