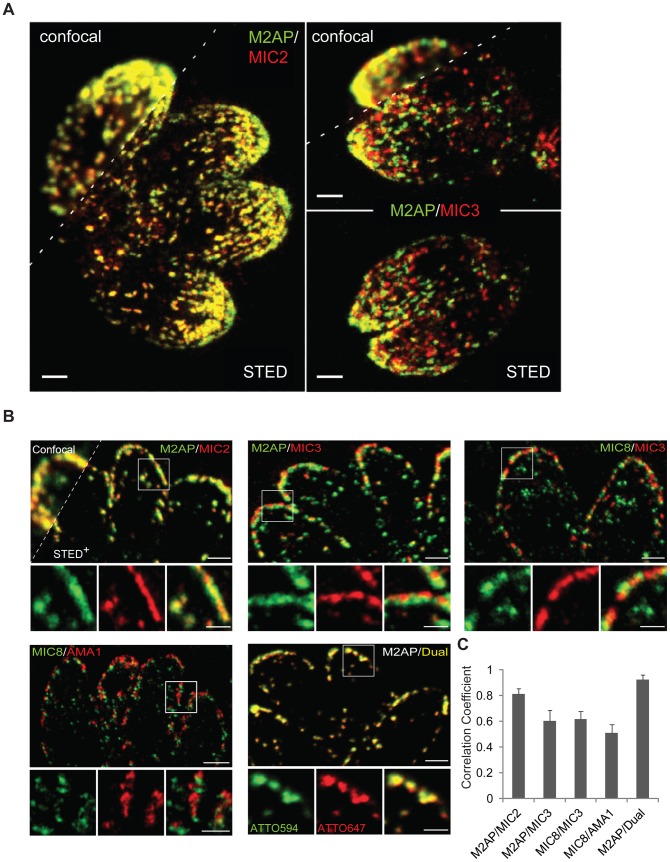
Figure 6. Two-colour STED analysis reveals different localisiations of microneme proteins in wild type (RHhxgprt−) parasites.
(A) Two-colour STED (Stimulated Emission Depletion) measurements on intracellular wild type (RH hxgprt−) parasites reveals high-resolution of microneme organelles at the apical complex. Resolution obtained in confocal mode does not allow discerning single organelles at the densely packed apical pole of T.gondii while STED microscopy enables a precise (co-)localisation analysis. Dual labelling of MIC2 and M2AP, and M2AP and MIC3 on whole-mount parasites shows a perfect co-localisation for the complex forming microneme proteins MIC2 and M2AP, but M2AP and MIC3 exhibit distinct localisations. Scale bars represent 1 µm. (B) Two-colour STED images of typical microneme co-localisation patterns in 100 nm ultrathin sections. Intracellular wild type (RH hxgprt−) parasites were immunolabelled with indicated antibody combinations. Confocal and STED+ (linear deconvoluted) resolution is shown for M2AP/MIC2). As a positive co-localisation control dual labelling of M2AP with a mixture of ATTO 594-and ATTO 647N-labelled secondary antibodies (M2AP/Dual) was performed. Scale bars for the overview images represent 1 µm and for close-up images 0.5 µm. (C) Quantification of the correlation between indicated micronemal marker proteins from (B) by calculating the Pearson's correlation coefficient. M2AP-Dual represents the positive control for the correlation analysis.

