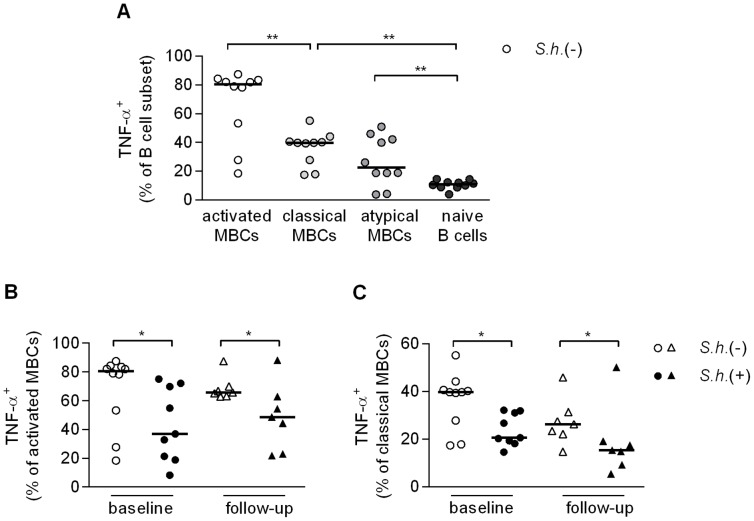
Figure 6. B cell subset inflammatory cytokine response, activation and proliferation.
Total peripheral blood B cells were cultured with anti-IgG/IgM (2.5 µg/ml) for two days, restimulated with PMA/Ionomycin/LPS and BrefA, fixed and stained with B cell subset markers (CD10, CD19, CD21 and CD27) and levels of intracellular TNF-α was measured in S. haematobium-uninfected children by flow cytometry (A). Levels of intracellular TNF-α in activated MBCs (B) and classical MBCs (C) in infected and uninfected children at baseline and follow-up. Horizontal bars represent median. Number of donors in each group: baseline S.h. −ve n = 10, baseline S.h. +ve n = 9, follow-up S.h. −ve n = 7 and follow-up S.h. +ve n = 7.

