
Figure 5. Crystal structure of 2H10 and NMR analysis of 2H10 interaction with the gp41 peptide.
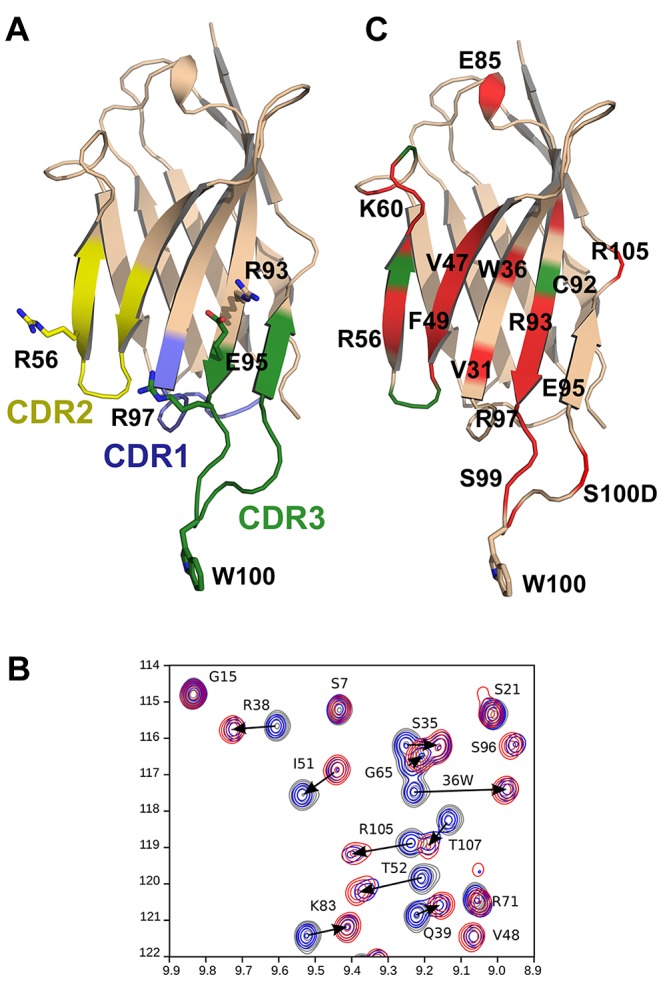
A) Ribbon representation of 2H10. CDR 1, 2 and 3 are colored blue, yellow and green, respectively. Residues implicated in gp41 interaction by mutagenesis are shown as sticks. W100 at the tip of CDR3 is required for neutralization. B) Selected region of the 15N HSQC spectra (see Fig. S3) recorded on a 13C,15N labeled 2H10 sample. Increasing concentrations of the gp41 peptide were titrated into the 2H10 solution and induced specific chemical shifts; spectra were recorded with a protein∶peptide ratio of 1∶0, in grey, 1∶0.5 in blue and 1∶1 in red.C) Chemical shift perturbations (CSPs) were mapped onto the 2H10 structure. Residues showing 15N,1H chemical shift perturbations greater than 0.15 ppm are shown in red and residues with an amide resonance disappearing in the free or the bound form are colored in green.