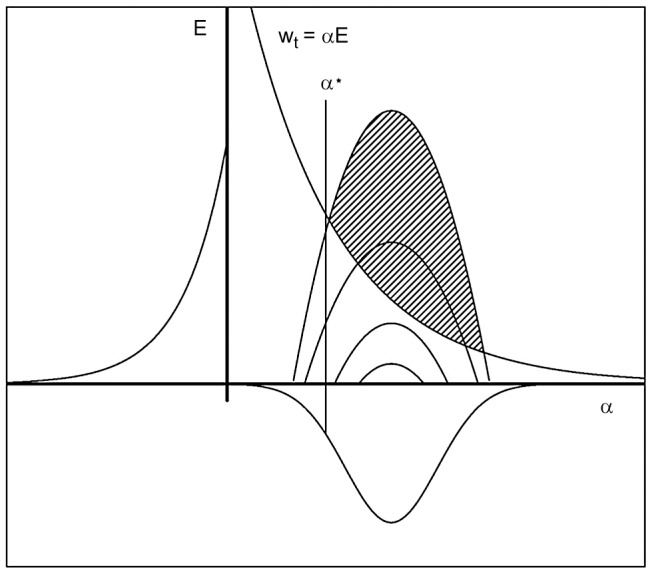
Figure 2. The marginal distributions of exposure and host susceptibility, together with contours of their joint distribution.

The y-axis shows exposure, E, and the x-axis shows host susceptibility, α. The line wT = αE describes the threshold of detectable infections: the minimum worm burden in an individual detectable by currently available assays. The shaded area depicts those combinations of α and E producing infection intensities above this lower limit of detection, wt. The fraction of the population susceptible to infection at or above this threshold is that lying to the right of the line α = α*.
